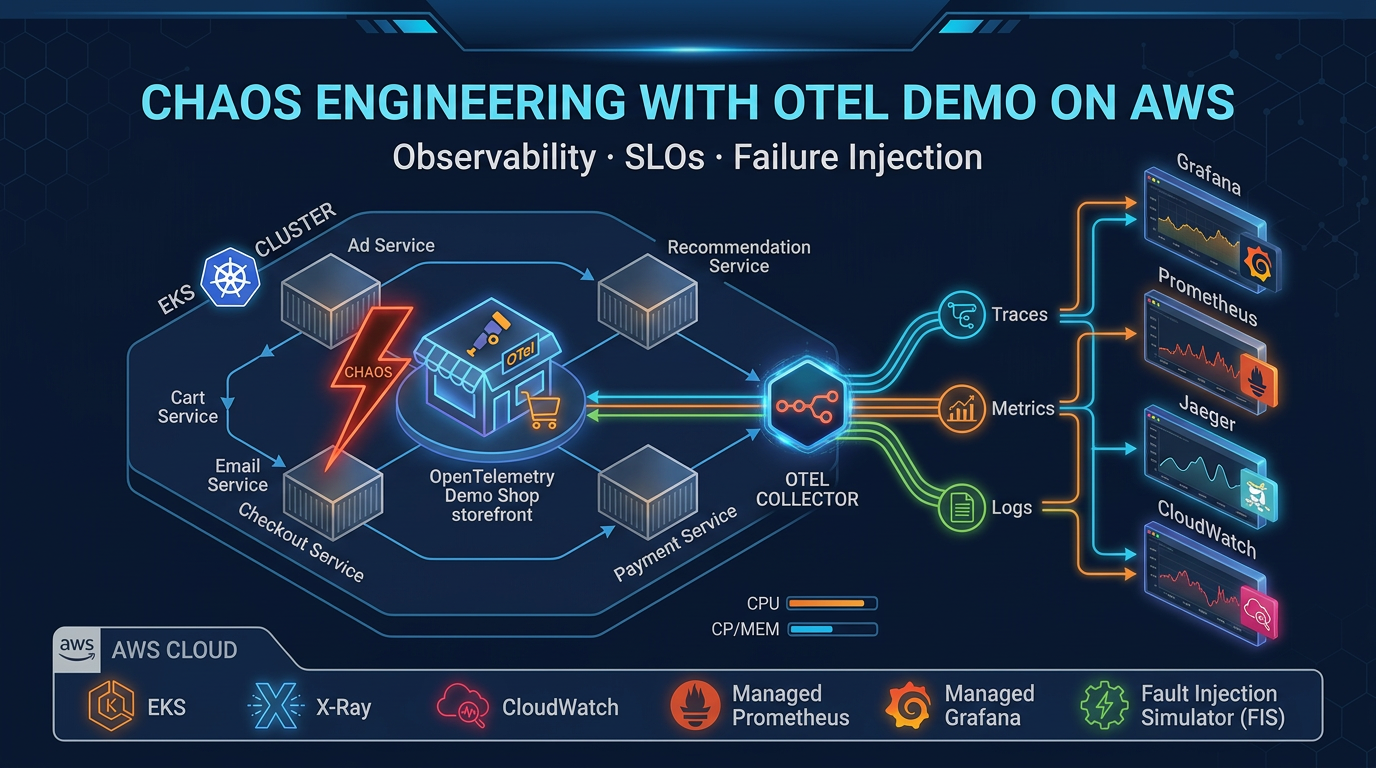
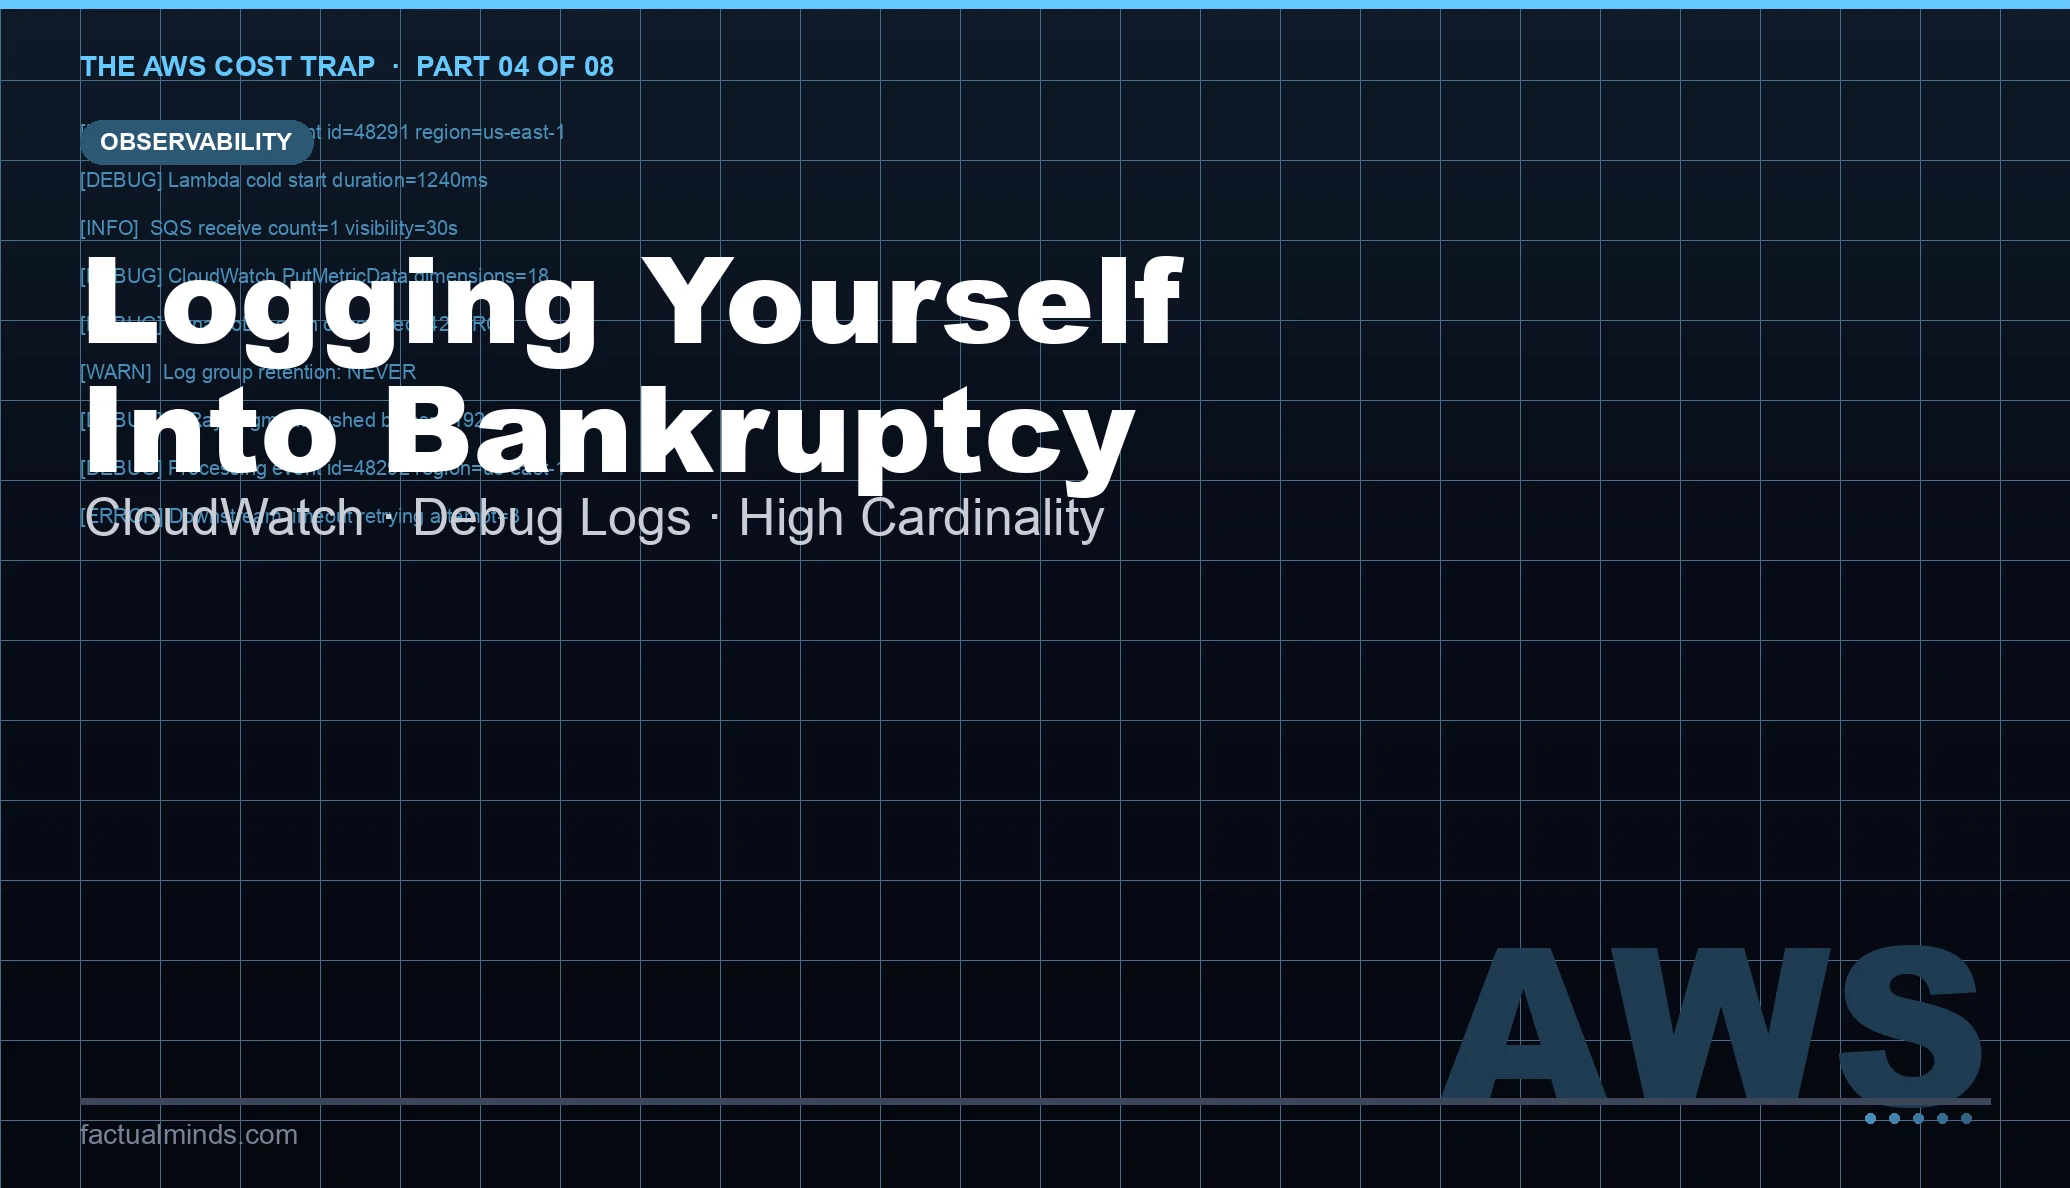
Log Aggregation and Intelligent Sampling with CloudWatch and OpenTelemetry
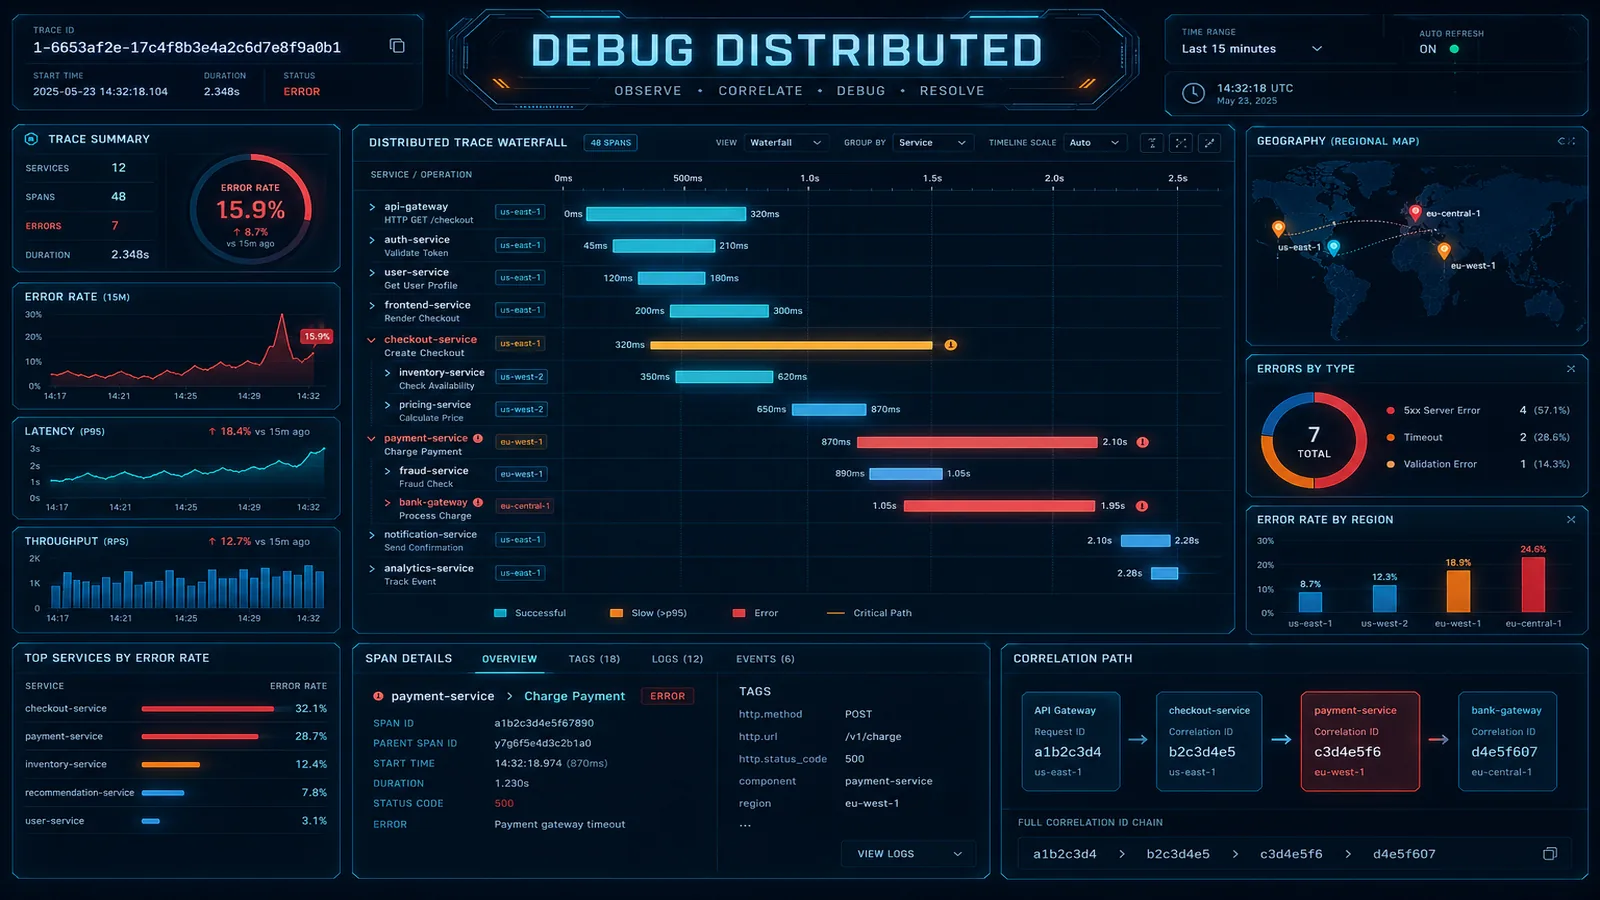
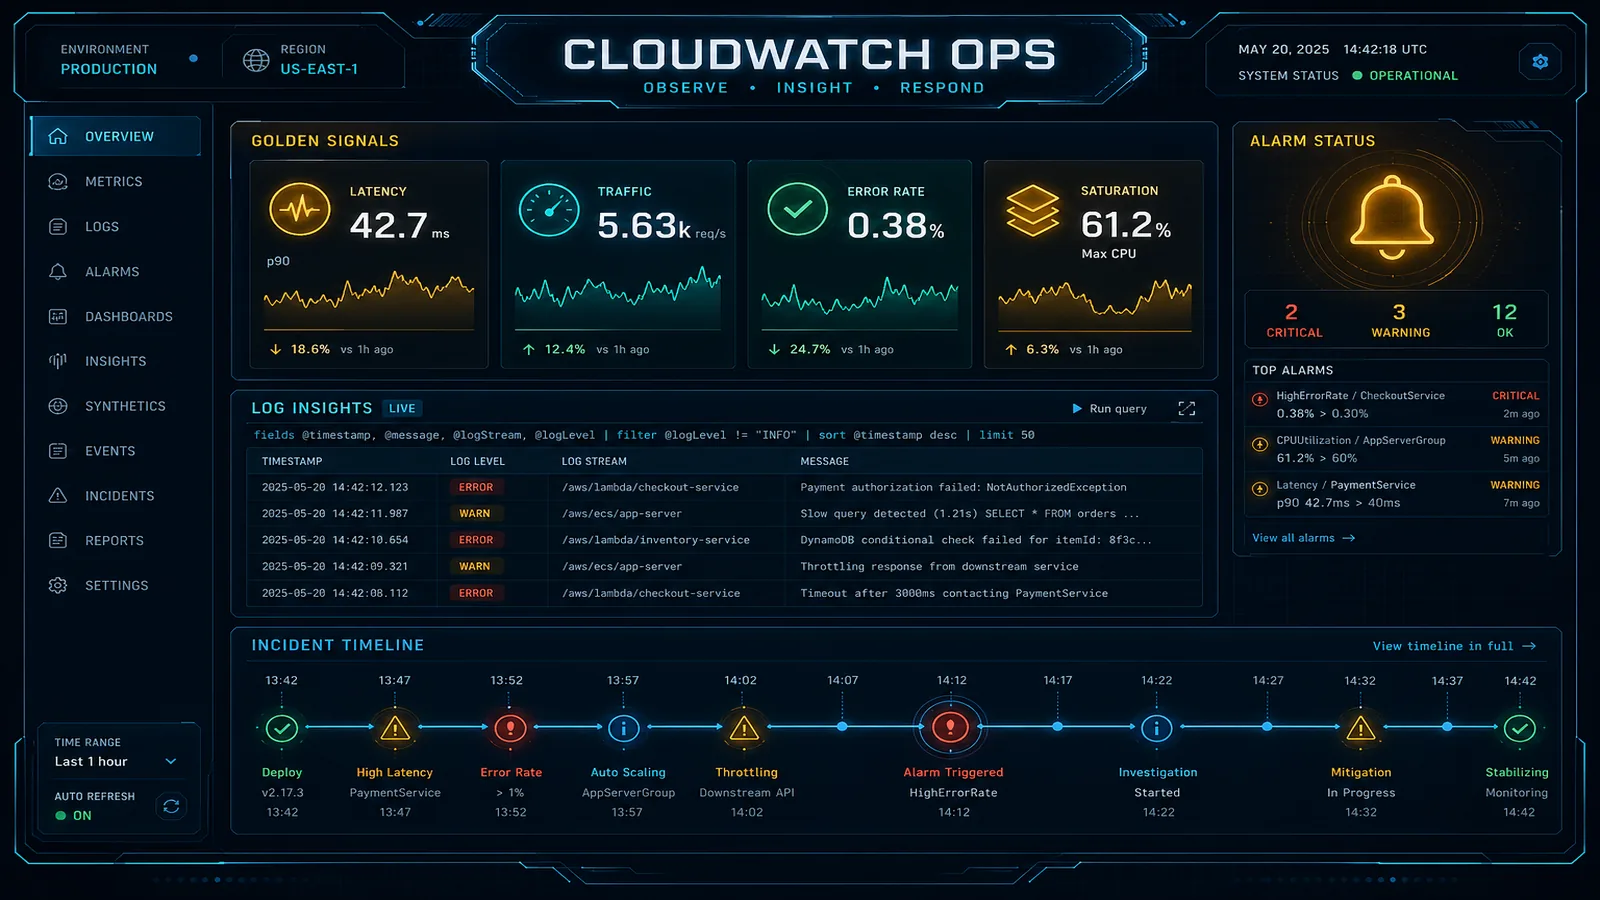
Ingesting every debug log to CloudWatch is how observability becomes a FinOps incident. Tail sampling with ADOT, Logs Insights, and Firehose to S3 for the long tail.
That `user_id` label on every HTTP metric turns Amazon Managed Prometheus into a five-figure line item. This guide explains cardinality mechanics, EMF vs remote write, and Application Signals defaults worth disabling.
The AWS observability team built a chaos engineering game on top of the official OTel Demo. 44 injected failures. Three signals. One LLM judge. Here's everything inside it.
Observability is not free, and the industry has collectively underpriced it. CloudWatch log ingestion, metrics explosion, and X-Ray trace volume can together exceed your compute bill — especially once AI workloads introduce high-cardinality telemetry at scale.
AWS publishes every price on a public page, yet bills still arrive as surprises. The problem is not opacity — it is that real costs emerge from interactions between services, not from any single line item.
A 500ms latency spike in a distributed system could be a slow RDS query, a Lambda cold start, a downstream API timeout, or a CloudWatch Logs ingestion delay. Finding the cause requires correlated logs, traces, and metrics — not grep.
CloudWatch is the most underused service on every AWS bill — and the most overspent on the ones that take it seriously. Logs, metrics, and alarm patterns that catch real outages without burying you in noise (or in the bill).